


You don’t need to look far on the Web to find infographics that showcase data in more compelling ways than you could possibly do with basic spreadsheet charts. Adding colorful infographics to your small business marketing strategy can help you deliver your message in a visually appealing way, thus making it—and your company—more memorable.
Luckily you don’t need a design degree to create great-looking infographics for blogs and other social media sites. You’ll find lots of software tools to do it, but we rounded up the five best online infographic tools to help you get started
The 5 Best Online Inforgraphic Tools
1. Piktochart
Piktochart lets you create infographics using a simple drag-and-drop functionality. The company offers a free version and three for fee-versions. Pricing ranges from $14 per month (paid yearly), $22 per month (paid quarterly) and $29 per month (paid monthly). The paid versions offer more features, images and customization.
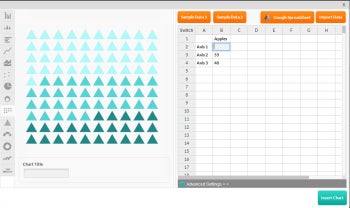
Figure 1: Charts in Piktochart infographics link to underlying data tables, which you can easily edit.
Sign up for a free account and then, to get started, select a theme for your graphic. Piktochart’s charts link to underlying data tables, so you can click a chart to view and edit its data. You can also create charts using data that you import or that resides in a Google Spreadsheet.
Piktochart builds infographics from multiple content blocks, and you can remove blocks that you don’t want, or add additional ones. The service offers a healthy range of icon-style graphics that you can add to your charts, too.
Once you’ve created your infographic, click Publish to publish it to JPG or a PNG format. If you have signed up for a paid version, you can export the chart to PDF.
2. Visual.ly
Visual.ly automatically creates infographics that track your social media stats, on sites like Twitter and Facebook. To get started, go to the site and select a type of template such as Business Tools, and then choose the template for the site stats you want to track, such as Facebook Insights, Google Analytics and so on.
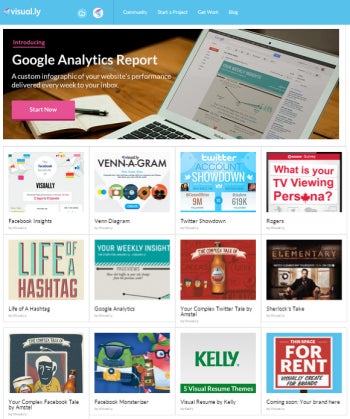
Figure 2: Choose from a number of templates on Visual.ly, which automatically creates infographics that track your social media stats.
You need to sign in to the appropriate service—Facebook or Google, for example—so that Visual.ly can gather your statistics from that site and render them in the infographic. Let’s say you wanted to track a Facebook page; the resulting infographic will show you the fans and engagement statistics for the last 30 days, as well as demographic data on page followers.
Once Visual.ly completes your infographic, you can publish it to Twitter, Facebook, Google Plus or Pinterest; or you can download it as an image or PDF file.
It’s easy to create appealing infographics at Visual.ly. However, we wish the site offered more customization; currently you can choose only one style for each type of infographic.
3. Easel.ly
Easel.ly, currently in free beta testing, makes creating your own infographics, well, easy. Click the Start Fresh link on the home page, and it takes you to your artboard where you build your design. Click Vthemes to choose a theme for your graphic—at the time of writing you could choose from 15. Drag-and-drop the theme graphic onto the artboard and customize it to suit your needs.
Unlike Piktochart, you build the chart graphics in Easel.ly by hand. That means you need to analyze your data and figure out the best way to present it. Then you create the individual charts piece by piece. You have a lot more control over how everything looks this way, but the infographics take longer to build.
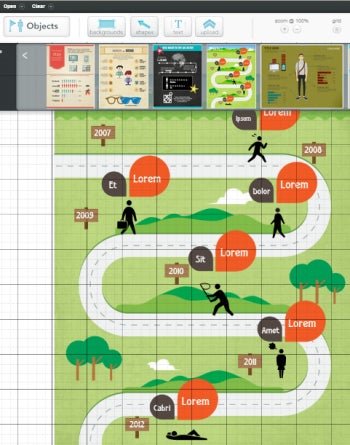
Figure 3: Easel.ly combines a range of design options with the capability to build your charts by hand.
Easel.ly provides a good selection of graphic objects to build your charts, and you can easily recolor them to match your theme colors. If you want more control over how your infographics look, and you’re reasonably design-confident, then Easel.ly gives you the tools you need.
4. Infogr.am
At Infogr.am you can create both charts and infographics for free, and the charts link to an underlying data table. That makes the charts easy to create, and you can change them easily by editing the data.
Start by clicking on a design to create, and then type over the text elements with your own text. Double-click on a chart to edit it, or add a new chart from the range of charts that include word clouds, tree maps, progress charts, tables and other pictorial options. You can also add maps, images, video, and text to your graphics.
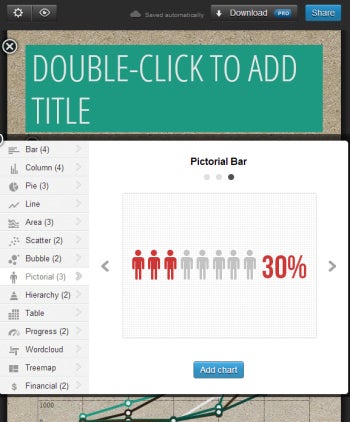
Figure 4: Infogr.am excels at making charts, and you can create range of charts from your own data.
When you’ve finished your design you can share it on Facebook, Twitter or Pinterest, or you can view it on the Web. Pro users ($18 per month), can download the chart in formats such as PDF and PNG, share the chart privately and protect their infographics with a password.
5. Venngage
Venngage is another online infographic tool that comes in both a free and a for-fee version. The paid version ($19 per month) includes premium elements such as charts, themes, templates and icons, as well as the capability to export to PDF or PNG. The free version has fewer options, and you can only view and share graphics online and not download them.
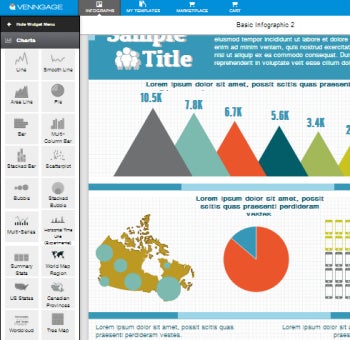
Figure 5: You add and customize Venngage objects by using widgets, and the service offers plenty of options to create custom graphics.
Once you’re signed in you can choose a template to start your graphic. You need to add it to your cart, and then checkout to use it—even if the template is free. Once the template is in your My Templates list, you can open and use it.
Charts consist of objects controlled by widgets. That means you need to double-click on an object to open the widget so you can make changes. It takes a little time to get familiar with this model, but it does give you plenty of customization options.
Venngage offers a good range of chart types and pictograms, and the designs are clean and attractive.
Helen Bradley is a respected international journalist writing regularly for small business and computer publications in the USA, Canada, South Africa, UK and Australia. You can learn more about her at her Web site, HelenBradley.com
| Do you have a comment or question about this article or other small business topics in general? Speak out in the SmallBusinessComputing.com Forums. Join the discussion today! |