 This table shows the data used to create these charts. You can use the table and follow the steps to practice creating charts. (Click for larger image). |
You may not know this, but you can use Microsoft Access to create charts of data stored in your database – making it easier to analyze – without leaving Access. In addition, you can create charts that appear automatically on Access forms so that you can see key information graphically rather than reading it from the data. In this article, I’ll show you how to create two different types of charts in Microsoft Access.
The charts are based on the data shown in this table. This is a simple product list describing the supplier, category and cost price for each product as well as the numbers of units in stock, on order and the reorder level.
How to Make a Pivot Chart
Armed with your data, you can create a chart by choosing View > PivotChart View. This shows you a blank chart into which you drag and drop the fields that you want on the chart. For example, drag the “Supplier” and “ProductID” fields into the area that’s called Drop Category Fields Here. Drag the “Units In Stock” field from the Chart Field List onto the area called Drop Data Fields Here.
You should now have a chart visible on the screen. At the moment, you can see all the Suppliers and their associated Product IDs. If you drag the Product ID category title to the left of the Supplier category, you will see the Product IDs and the Supplier names for each of them.
You can alter the chart by dragging and dropping fields into various places. Make sure, however, that you arrange the chart in a way that makes sense.
You can also filter the chart to, for example, see only Condiments. Do this by ensuring that the Product Category field is on the chart, and then click the dropdown arrow to the right of the Product Category and select only the Condiments checkbox.
 You can create a pivot chart based on the data in an underlying pivot table. (Click for larger image). |
You can also view, for example, just the products sold by a certain supplier if you select the checkbox for the Supplier name.
When you have your chart arranged the way you want, you can add titles to it, such as an Axis Title, by clicking in the box that contains the title. Next right-click and choose Properties. Click the Format tab to type a new caption for this part of the chart.
The PivotChart is based on an underlying PivotTable that you can view by selecting View > PivotTable View. To return to the chart choose View > PivotChart View.
You can have only one PivotTable — and its related PivotChart — associated with a table. The PivotChart and PivotTable are saved and accessible to you anytime you open your data file.
How to Make Charts on Access Forms
To make a chart on a form, first create the form for the table. You do this through the forms option in the database switchboard by choosing the Create Form by Using Wizard option.
Open the form and click the Design View button to switch to the Form Design View. Drag on the outer edges of the form so you have plenty of room for the chart to appear. Choose Insert > Chart, and drag where you want the chart to appear inside the form. When the Chart Wizard dialog appears, select the table, and click Next.
Next you need to choose the fields you want in your chart — for example the fields containing the Product Category, Units In Stock and Units On Order details. Click Next. Select the type of chart you want, such as a column chart, and click Next.
Assemble the pieces for the chart by dragging all the items out of the boxes in the left panel so you can see the boxes you are using. Then drop the Product Category field onto the Axis box, and drop Units In Stock and Units On Order onto the Data box, click Next.
Double-click on Units in Stock, and click None. Repeat these steps for Units on Order, and click OK. Now click Next and the ProductID field should appear in both the Form Fields and Chart Fields boxes.
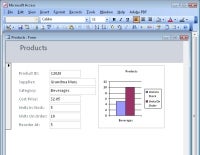
Click Next, type a name for your chart and choose the Display a legend option, and click Finish. A chart will appear in Form Design view, and you can see it in place on the form when you select Form view in the future.
Instead of simply showing raw figures, charts provide your audience an easier way to understand the information in your database.
You’ll find lots more software tips and tutorials from Helen Bradley in our Small Business Essential series, How-To With Helen Bradley.
Helen Bradley is a respected international journalist writing regularly for small business and computer publications in the USA, Canada, South Africa, UK and Australia. You can learn more about her at her Web site, HelenBradley.com
| Do you have a comment or question about this article or other small business topics in general? Speak out in the SmallBusinessComputing.com Forums. Join the discussion today! |


